![]() ISSN 0798 1015
ISSN 0798 1015
![]()
![]() ISSN 0798 1015
ISSN 0798 1015
![]()
Vol. 41 (Issue 17) Year 2020. Page 13
SARIEGO-LÓPEZ, Ignacio 1; MORENO-MELGAREJO, Alberto 2; GARCÍA-MORENO GARCÍA, María B. 3
Received: 24/01/2020 • Approved: 13/04/2020 • Published 14/5/2020
ABSTRACT: The following paper illustrates tourism demand in Cantabria (Spain). By fully understanding the relationship between purposes of travel, main attractions visited throughout the destination and sort of accommodation, this paper aims to identify the degree of relevance for each of them in order to tackle consistently tourist loyalty. An empirical study was carried out among 2,155 tourists visiting Cantabria. Research findings evidence that purpose of visit, the accommodation and spatial behavior significantly influence tourists' intentions to make repeat visits. |
RESUMEN: El siguiente artículo ilustra la demanda turística en Cantabria (España). Analizando la relación entre el propósito del viaje, las principales atracciones visitadas en el destino y el tipo de alojamiento, el artículo tiene como objetivo identificar el grado de relevancia de cada uno de ellos en la repetición. Se realizó un estudio empírico entre 2.155 turistas que visitaron Cantabria. Los resultados de la investigación demuestran que las variables analizadas influyen significativamente en las intenciones de los turistas a la hora de regresar al destino. |

The aim of this paper is to develop and empirically validate for understanding the reasons related to (i) why first-time visitors become a repeat visitors, (ii) what kind of first-time visitors turn into repeaters and, (iii) how a destination can establish a strong brand loyalty.
For this purpose and based on a literature review, this paper analyse Cantabria´s visitors to determine whether there is a distinctive profile about repeat vacationists in relation to variables such as main motivation, sort of accommodation, overnight stay, attractions and locations visited within the destination (spatial behaviour), group size, age and origin. In addition, this study is also valuable when promoting an attraction corresponding to a specific visit frequency.
The tourist experience is shaped by countless patterns, so many authors (Hämäläinen, 2005; Kozak et al., 2005; Yoon & Uysal, 2005; Dougan, 2007; Dritsakis, 2007; Potocka, 2009; McLaren, 2010; Kim et al., 2013; George, 2014; Puah et al. 2014; Rojas, 2014; Xu et al. 2015; Özdemir et al. 2017; Okubo et al. 2017; Tisdell, 2017) have conducted varied research in different tourist destinations to model behaviors illustrating economic, social and political trends and technological and environmental factors that affect the size and characteristics of tourism demand.
Tourism demand and loyalty, an intensely researched construct which is known to affect deeply travel decisions, have to date not been integrated into the travel motivations perspective; and it is fundamental to evaluate the impacts on economic growth of tourism-driven economy (Schubert et al., 2011; Seetanah, 2011).
Tourism demand corresponds to the total number of people participating in tourism activities generated by the need of individuals to enjoy the experience of being in other places. Tourists are the real central character of the industry, final consumers of services and products offered at a destination. Cooper (2004: 76) defines demand as “a schedule of the amount of any product or service that people are willing and able to buy at each specific price in a set of possible prices during some specified period of time”. On the other hand, tourist motivation is a subset of tourist demand, and tourist demand is antecedent to actual travel and its satisfaction (Dann, 2012: 165).
Different patterns shape tourist destination experiences. Tourists have more and more options to substitute the destination, period and recreational experience due to posfordist flexibility that this economic activity is gaining. Thus, understanding tourist segments becomes crucial to anticipating the prospective geographic and seasonal shifts while increasing tourist arrivals (Sariego & Mazarrasa, 2017). Tourism is shifting from mass tourism activities to more specialized niche markets and customized products. To remain competitive, destinations must respond to changing market demand (Gill, 1998). Being small and unique gives many destinations a competitive edge over other more established tourism spaces that are quickly becoming part of a homogenized and undifferentiated global economy (George et al., 2009: 248).
Knowing tourist demand is a valuable source of information in the decision-making process for the best use of attractions and resources within the destination (González & Conde, 2011). The characteristics of tourist demand at a given destination, understood as a set of goods and services consumed during tourist stays, greatly affect the development of that territory. However, studying some of the standard measures of socio-demographics only partially explains variations in tourism consumption (Shaw, G, Williams A,2004: 130).
Destination loyalty has been gaining interest among scholars since the 1990s with Oppermann (1997) introducing the relationship between previous purchase with future purchase behavior. The literature has attempted the revision of a broad set of concepts related to loyalty such as image, perceived quality, satisfaction (Bigné et al., 2001), destination safety, cultural differences, previous experiences (Chen & Gursoy, 2001) or, the motive for traveling and satisfaction with the voyage (Yoon & Uysal, 2005). The majority of the previous researches in this topic reveal that “the tourist’s satisfaction; the destination’s image and the quality of service are predictors of loyalty” (Cossío-Silva et al., 2019: 72).
Knowing which factors help to encourage loyalty in tourism, as well as a good operationalization of the loyalty construct, are key to implementing and measuring the impact of marketing strategies. It is essential to identify what generates loyalty and defining the key indicators for measuring it (revisit and recommendation) in order to be able to design successful relationship strategies. Accordingly, as Campón et al. (2013) observe, in the case of tourism, those benefits are related to getting a loyal customer as a foundation to further improve the profitability of destinations and their organizations.
Travelers who return to a destination are known as repeat tourists. The transformations between first-time and repeaters attract interest among researchers (Anwar & Sohail, 2004; Chi & Qu, 2008; Fallon & Schofield, 2003; Hughes & Morrison-Saunders, 2002; Kemperman, et al. 2003; Okamura & Fukushige, 2010).
Today destinations face the stiffest competition in decades, and it may grow tougher still in years to come. In this regard, destination managers need to understand why tourists are faithful to them and what are the reasons explaining their loyalty (Chen & Gursoy, 2001).
Although research is not conclusive about the repeat visit phenomenon (Pereda,M.H. 2002 all researchers agree that the first direct contact with the destination and the actual experience ‘on site’ have direct implications for the future choice process (Opperman, 2000). Besides, the findings of Fakeye & Crompton (1992) show that “social contact” is significantly more important for repeat tourists than for first-time visitors. Perceived image of natural resources, perceived image of service quality, perceived image of entertainment, and affective image were influences on tourist loyalty level (Hernández et al., 2006).
However, Fallon & Schofield (2003) show that the overall satisfaction of first-timers and repeat visitors was explained by different hierarchies of elements. Other studies point out that a second visit greatly increases the possibility of further visits in the future, and that it has micro and macro positive effects (Juaneda, 1996; Üner & Armutlu, 2012).
As Opperman (1997: 179-180) points out, given the emerging significant changes between first-time and repeat visitors one needs to probe deeper to identify the real cause of these transformations. Furthermore, identifying the differences between first-time and repeat visitors' travel experiences is likely relevant for destination managers, particularly to identify differences in their pre-travel and post-trip characteristics (Li et al., 2008). Understanding these changes is of crucial relevance in developing effective tourism marketing and management strategies as well as in building travel motivation and decision-making theories (Lau & McKercher, 2004; Oppermann, 1997; Petrick, 2004).
A number of researchers have described the differences amid first-timers and repeaters. For instance, the research findings of Petrick (2004) show relationships between reputation, emotional response, monetary price, behavioral price, quality, perceived value, and repurchase intentions. The most notable differences include demographics, tripographics, destination perceptions, perceived value, and travel motivations (Li et al., 2008). In general, first-time visitors are more likely to be younger and less likely to visit friends/family than repeat visitors (Gitelson & Crompton, 1984; Oppermann, 1998; Lau & McKercher, 2004). First-timers usually sightsee a destination extensively and join in a diversity of activities, with particular interest in iconic attractions and well-known events. First-timers also incline to shorter stays and have more complex and differentiated images of destinations than repeat visitors (Fakeye & Crompton, 1991).
On the other hand, Reid and Reid (1993: 3) suggest that “repeat visitors represent more than just a stable source of revenues, but also act as information channels that informally link networks of friends, relatives and other potential travelers to a destination.”
Oppermann (2000) found that the frequency of past visitation had an influence on future destination choice. Focusing on past visitation addresses only the behavioral aspect of loyalty and it was argued (Chen & Gursoy, 2001) that destination loyalty does not necessarily have to depend on repeat visits but can be viewed from the attitudinal aspect, which is the willingness of tourists to recommend a destination to others.
In the end, successful conversion of first-time visitors into returning visitors depends on the ability of tourist destinations to provide visitors tailored activities to satisfy their needs (Kruger et al., 2010).
As it has already been pointed out, there is no simple answer to the question of what makes someone a repeat tourist: loyalty. Seasonal (second) homeowners are some of the most visible and frequent repeat tourists to a destination. However, repeat tourists are also obviously closely related to visiting friends and relatives segment staying at their places without searching for private accommodation. Therefore, repeat tourists are initially strongly related to the sort of accommodation they choose within a destination (Brida et al., 2012). The reasons for substantial difference on the demand-side are extensively documented. Essentially, they relate to climatic conditions, demographic, lifestyle as well as structural or institutional factors (Baum & Hagen, 1999). The changes in objectives between fist-time tourists and repeat tourists and these changes might be revealed in changes in consumption patterns (Okamura & Fukushige, 2010).
Accordingly, many organizations have come to realize the economic importance of a loyal customer base (Campón et al., 2013; Chi & Qu, 2008; Loureiro & Kastenholz, 2011). In a market as complex as tourism, most innovative accommodation initiatives are developing value propositions to satisfy the desires of different type of frequent visitors.
In the context of tourism, spatial behavior refers to the ‘sequence of attractions visited by tourists within a geographic space’ and the sequence of movements in that geographic space “between one attraction and another” (Xia, 2007: 26). Shortage of information related to public transport systems and ticketing can influence the mobility of a tourist in a territory (Edwards & Griffin, 2013). Accordingly, loyal visitors could learn about these services and adopt different spatial behavior throughout the destination.
Consequently, tourists’ spatiotemporal behavior has important implications at both destination and business level. In the context within a destination, this understanding is valuable regarding ‘infrastructure needs, transportation development, product development, destination planning, and the design of new attractions’, in addition to tourism impact management (Lew & McKercher, 2006).
Travelling reflects objective behavior that results from subjective decision making (Dunkley et al., 2011 Tussyadiah & Zach, 2012). Accordingly, two basic perspectives of study can be identified: a behavioral approach, which focuses on physical movements, and a cognitive approach that focus on the underlying decision process. Both perspectives provide crucial information for planners, marketers and operators of tourist destinations to make decisions enhancing the tourist experience (Xia et al., 2011).
Differences between first-time and repeat visitors’ destination consumption are to be expected. On the one hand, first-time tourists are destination-unacquainted, discovering a place for the first time. On the other hand, repeat visitors are somewhat destination-familiar tourists, with the degree of awareness depending on the number of prior visits (McKercher et al.,2012a). Changes in repeat tourists’ behavior can result from pre-trip decision making and the selection of onsite destination activities (Lehto et al., 2004). Relaxation and familiarity were identified as the most distinguishing motivational factors for repeat tourists, while novelty and new cultural experiences were regarded as the most decisive motivations for first-timers (Li et al., 2008).
Reisinger (2009) studies purchasing decisions and he identifies three types of purchase: trial purchase, repeat purchase, and a long-term commitment purchase. A tourist opts for a trial purchase when he or she visits a tourist destination for the first time. At this stage, the tourist explores and evaluates a large number of tourism attractions within a destination because tourists are usually looking to enjoy new experiences: “first-timers tend to travel more widely throughout the destination while repeat visitors tend to confine their actions to a smaller number of locations” (McKercher et al., 2012b: 147). Repeat tourist purchase happens when first-time buyers are pleased about the trial and products meet their approval. This is when they are willing to visit a destination on further occasions or more frequently. Finally, long-term commitment purchase is closely linked with friends, relatives and purchase of a holiday home.
Furthermore, first-time visitors are more likely to visit large-iconic attractions and walk through the most famous streets, while repeaters tend to be more selective, visiting fewer locations but spending longer time (Caldeira & Kastenholz, 2017).
Cantabria is an autonomous region located in the north of Spain and was visited by 5,041,784 tourists in 2017 (INE, 2018a, INE, 2018b), approximately ten times more than its population. It is relevant to point out that more than 90% of this figure corresponds to domestic visitors arriving from all over the country.
Far from Spain’s main tourist trails, Cantabria escapes relatively intact from visitors who flock to other destinations in the country located mainly in the islands and along the Mediterranean shoreline, such as Balearic Islands, Canary Islands, Costa Brava or Costa del Sol.
Figure 1
Map of Cantabria’s main destinations and tourist attractions analyzed
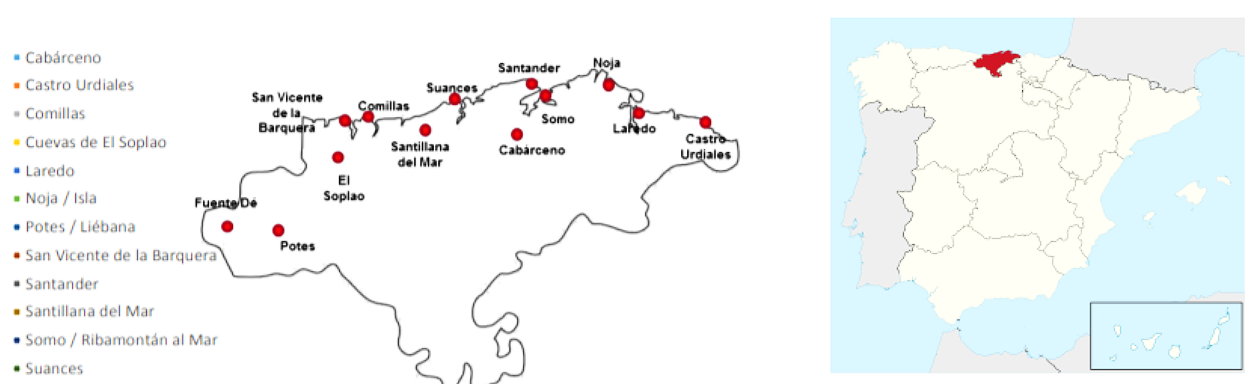
Source: Sariego & Mazarrasa, 2017: 423
The study of tourism demand represents a great complexity resulting from its peculiar characteristics: spatial, seasonal, elastic and unstable concentration. In order to diagnose a tourist market at a destination, it is essential to know the visitors’ characteristics, travel habits and satisfaction, as well as the relationships between its constituent nodes or points. Generating key performance indicators related to satisfaction, marketing and perception of visitors helps to constitute a more competitive destination (González & Conde, 2011). Starting from the premise that tourism is one of the main economic activities of Spain and, to a lesser extent, of Cantabria, its development is improving economic opportunities for each region, and it is helping to consolidate job opportunities and economic prosperity (Sala et al., 2014: 351). More and more entrepreneurs are investing in the hotel industry. In the last three years, the number of tourist accommodation firms in Cantabria has grown by more than 6% (INE, 2018c). In spite of representing, in surface area and population, little more than 1% of the Spanish territory, Cantabria is contributing year after year to the increase in the number of international tourists visiting Spain. However, the destinations and attractions spread throughout Cantabria are still not relevant for international arrivals in comparison with the rest of the country. Out of the 82 million visitors to Spain in 2017, Cantabria received around 400,000 tourists from abroad.
However, tourism figures in Cantabria acquire more relevance when compared with those of its direct competitors, the Green Spain regions located along the northern shoreline. Cantabria, Asturias, Galicia and the Basque Country compete with each other by offering similar tourism attractions. Cantabria, being the smallest of the group, achieves excellent tourist results compared with those of its competitors in northern Spain. The average overnight stay value of 2.35 nights per tourist is significantly higher than the 2.03 for Asturias, 1.91 for Galicia, and 1.90 for the Basque Country. As regards the data relating to supply, demand and inhabitants in 2016, Cantabria stands out for its higher tourism density and intensity. While the hotel sector in this region accounted for 4.69 overnight stays per inhabitant, Asturias registered 3.32, the Basque Country 2.47, and Galicia 3.03. In terms of supply, Cantabria has 2.59 hotel accommodation places for every 100 inhabitants, while Asturias offers 2.27, the Basque Country 1.27, and Galicia 2.26 (INE, 2017a). The results of the camping service are also satisfactory, with a total of 1,300,867 overnight stays. This is considerably higher than the 789,342 in Asturias, 961,778 in Galicia, or 608,250 in the Basque Country (INE, 2017b). Based on this positive analysis of Cantabria in comparison with its domestic competitors, this paper focuses on exploring relationships between purpose of travel, type of accommodation, and spatial behavior within the destination.
To evaluate the impact of the different research variables among tourists visiting Cantabria, participants had to complete a closed survey with different questions related to the implementation of this methodology. The quantitative survey framework in which the study was carried out includes 17 questions with 102 possible answers, administered to 2,155 tourists visiting Cantabria in high season (Easter holidays and summer season).
Tourist populations of 1,657,990 tourists (INE, 2016) were staying in the one of the four categories of accommodation: hotels, rural tourism accommodation, touristic apartments and camping. This figure includes domestic and foreign travelers in 2015.
The study was divided into two sessions: Easter holidays and summer season, evaluating the major tourist destinations within the Cantabria region. In each session, a sample of 1,077 tourists responded to the same questionnaire, representing a 95% confidence level and a 3% margin of error.
In the aforementioned sample, only tourists who repeated visits to Cantabria in high season (Easter and/or summer) were selected for this analysis; accordingly, this study consisted of 644 respondents.
The 2,155 surveys through which information was collected were conducted at 30 different locations spread across Cantabria as follows: Santander (6), Santillana (2), Suances (2), Comillas (2), San Vicente de la Barquera (2), Ribamontán al Mar (2), Noja (2), Laredo (2), Castro Urdiales (2), Potes (2), Fuente Dé (2), Cueva El Soplao (2) and Cabárceno (2) (Figure 1).
Statistical analysis and data tabulation were carried out with the statistical program SPSS v.22. The techniques chosen to perform this task seek to identify the possible existing relationships between the behaviors and/or motivations of repeat tourists to Cantabria, focusing especially on their repeated behaviors and/or motivations with respect to the previous trip. Specifically, the variables under study are: overnight stay on the last trip (A5), type of accommodation on the last trip (A6), main motivation on the last trip (A7), overnight stays on the current trip (A9), type of accommodation on the current trip (A10), and main motivation on the current trip (A11).
The qualitative nature of the variables under study determines the need to use dependence tests to detect relationships between them, in particular the Pearson’s Chi-Square test; although this test will be followed by calculation of the Cramer V to approximate the quantification of the detected relationships.
Then, correspondence analysis reveals structures of relationships between the variables, and allows us to convert qualitative data into numerical values, thus enabling graphic representation and, in turn, the discovery of patterns. This will determine the position of individuals in a series of characteristics through a vector space of two dimensions, in which greater or lesser proximity is equivalent to a greater or lesser degree of interdependence between the categories of each of the variables represented in the two dimensions in which they are grouped.
First of all, following Reisinger’s (2009) reference types of purchase of travel, Cantabria receives 42.7% trial tourist (first-time visits), 20.6% repeat visit (2-4 visits) and 36.6% long-term commitment visit (five or more visits). It is remarkable that more than fifty percent of tourists repeat their visit to Cantabria. This could be due to buyer experiences (product performance) exceeding expectations or confirming expectations. This effect leads to satisfaction with Cantabria as a destination, producing the effect of positive cognitive dissonance. Consequently, tourists are more likely to visit this destination again and become loyal to this region.
The next analysis is based on a survey of 644 repeat tourists visiting Cantabria in high season, in the most significant places already mentioned.
Considering the sociodemographic characteristics of the aforementioned tourists, it should be pointed out that they mostly represent domestic tourism (93.9%), the most common regions for inbound markets being Castilla-León, Madrid, and the Basque Country, with percentages of 22.2%, 20.3% and 19.6%, respectively. Focusing attention on the age variable, most tourists fall within the ranges of 26 to 40 years old (34.0%) and 41 to 60 (44.1%). Finally, regarding group composition, it should be noted that 57.0% of respondents travel as a family while 30.2% travel as a couple.
With the aim of discovering the existing relationships between the variables under study, the abovementioned dependency tests provided the results included in Table 1, where each of the cells shows Chi-Square values, maximum likelihood, and Cramer's V for each cross-tabulation of the variables analyzed.
Table 1
Dependence test results
|
A6. sort of accommodation on the last trip |
A7. main motivation on the last trip |
A9. overnight stays on the current trip |
A10. sort of accommodation in the current trip |
A11. main motivation in the current trip |
A5. overnight stay on the last trip |
197,000 (0,000*) 0,239 |
129,523 (0,000*) 0,185 |
586,010 (0,000*) 0,394 |
188,667 (0,000*) 0,233 |
99,829 (0,000*) 0,162 |
A6. sort of accommodation on the last trip |
|
271,678 (0,000*) 0,282 |
278,144 (0,000*) 0,286 |
1306,779 (0,000*) 0,634 |
202,050 (0,000*) 0,242 |
A7. main motivation on the last trip |
|
|
107,448 (0,000*) 0,170 |
229,423 (0,000*) 0,258 |
1233,002 (0,000*) 0,530 |
A9. overnight stays on the current trip |
|
|
|
288,083 (0,000*) 0,316 |
141,735 (0,000*) 0,194 |
A10. sort of accommodation in the current trip |
|
|
|
|
240,758 (0,000*) 0,265 |
*Significant to 5%
Source: Prepared by the authors
In light of the results, it can be affirmed that there are significant dependency relationships to a greater or lesser extent between each and every one of the variables considered. Thus, the interrelations between the number of overnight stays, the type of accommodation, and the motivations on the last trip and the current one are very much alike. Moreover, this close relationship of dependence between research variables determines, to a large extent, a similar spatial behavior between first-time and repeat visitors.
The dependency relationships between the different variables having been detected, some of the most representative graphs obtained with the correspondence analysis are shown: specifically, the graphs comparing the number of overnight stays, the type of accommodation, and the motivations on the current trip and the previous one. In each graph, the color blue represents the categories corresponding to each one of the variables in the current trip, while green shows the same for the previous trip. The fact that in the three graphs the green and blue points are so close –in most cases they even overlap– implies that there is no change in habits in the variables analyzed between the last trip and the previous trip; it only shows a certain distance in the category of overnight stays between 8 and 15 nights.
Figure 2
Overnight stay
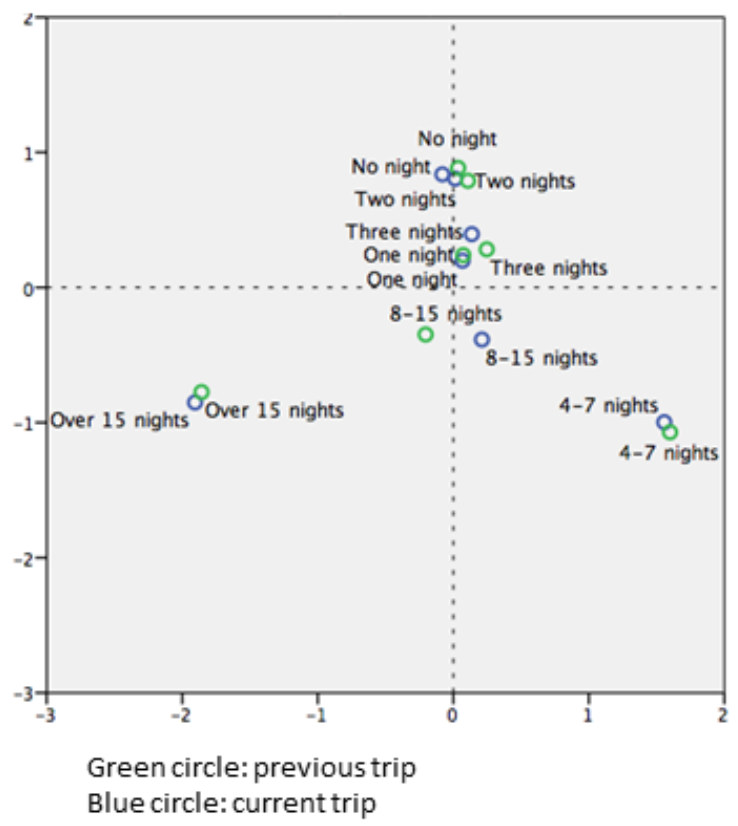
Source: Prepared by the authors
Figure 3
Type of accommodation
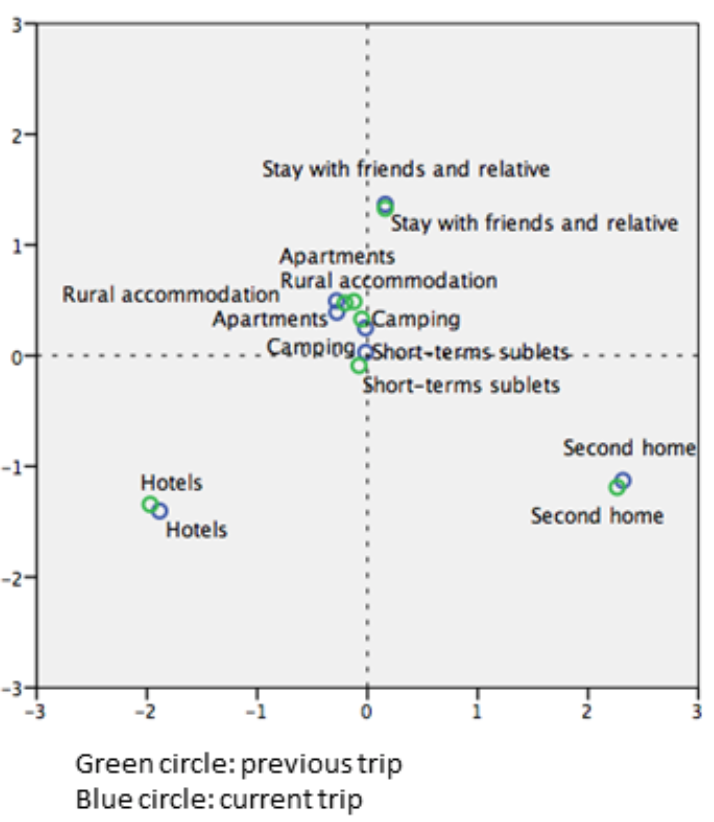
Source: Prepared by the authors
Figure 4
Main motivation
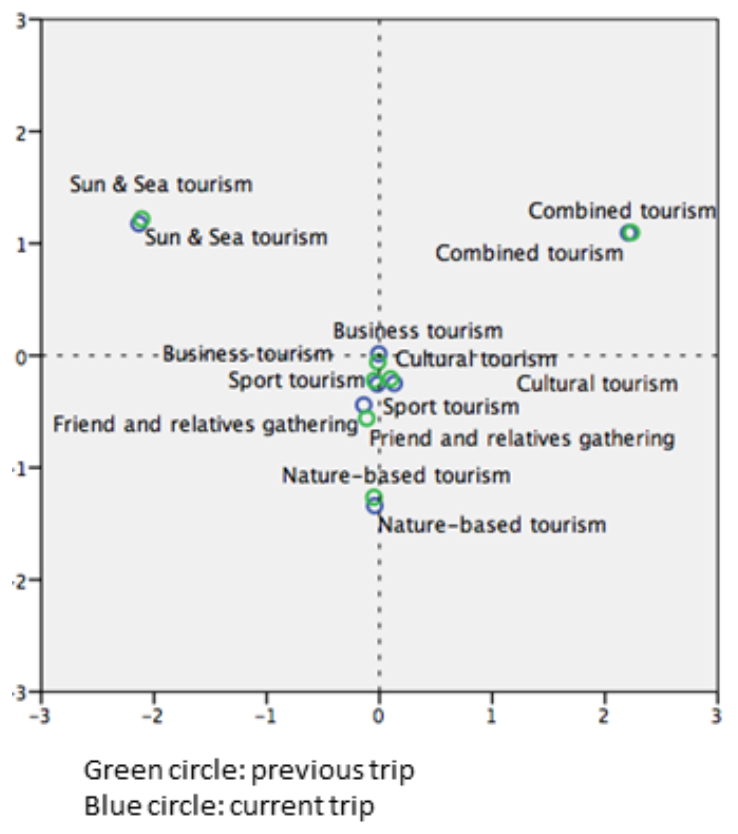
Source: Prepared by the authors
This paper makes a contribution to the literature on tourist destinations and how they can play a critical role in driving the loyalty and satisfaction of customers in a particular context. This study suggests that overnight stay, type of accommodation, and main motivation are variables closely related to loyalty. The main features of repeat-tourist behavior are similar to those exhibited on the first visit.
In this paper we used a questionnaire-based survey to study differences in purpose of travel, type of accommodation, spatial behavior, and sociodemographic characteristics between first-time and repeat tourists.
Firstly, the contribution of this manuscript is that the relationships between variables are similar for first-time visitors and repeaters. A study by Choo & Petrick (2012: 301) suggests that repeat visits are related not only with service providers but also with other customers and their companions.
Secondly, satisfaction and motivation are also the most important predictors of loyalty. Both are also increasingly linked with questions of identity (Richards, 2018: 5), and motivation and accommodation are part of this touristic identity; visitors usually follow a very similar pattern at the same destination. For instance, a domestic tourist who travels to Cantabria with a motivation of doing business and staying two nights in a hotel is likely to do something very similar on the next trip to the same destination. Furthermore, visitors who have a second home at the destination show a similar consumer behavior on every visit.
Lastly, although this research applies to one small region in Spain (Cantabria), the results could be extrapolated to other comparable domestic destinations. However, this study could be upgraded with more variables suited to an assessment of loyalty for tourism demand as a whole.
Anwar, S.A. & Sohail, M.S. (2004). ‘Festival tourism in the United Arab Emirates: first-time versus repeat visitor perceptions’, Journal of Vacation Marketing, 10(2): 161–170.
Baum, T. & Hagen, L. (1999). Responses to seasonality: the experiences of peripheral destinations. International Journal of Tourism Research, 1(5), 299-312.
Bigné, J. E., Sánchez, M. I., & Sánchez, J. (2001). Tourism image, evaluation variables and after purchase behaviour: Inter-relationship. Tourism Management, 22(6), 607–616.
Bosnjak, M., Sirgy, M. J., Hellriegel, S., & Maurer, O. (2011). Postvisit destination loyalty judgments: Developing and testing a comprehensive congruity model. Journal of Travel Research, 50(5), 496-508.
Brida, J. G., Monterubbianesi, P. D., & Zapata, A. S. (2012). Análisis de los factores que afectan la repetición de la visita a una atracción cultural: una aplicación al Museo de Antioquia. Cuadernos de Administración, 25(45), 87-112.
Caldeira, A.M. & Kastenholz, E. (2017). Tourists’ spatial behaviour in urban destinations: The effect of prior destination experience. Journal of Vacation Marketing, 24(3), 247–260.
Campón, A.M., Alves, H. & Hernández, J.M. (2013), “Loyalty measurement in tourism: A theoretical reflection“. In Mathias, A. (Ed.), Quantitative methods in tourism economics. Springer: Berlin, pp. 13-40.
Chen, J., & Gursoy, D. (2001). An investigation of tourists’ destination loyalty and preferences. Journal of Contemporary Hospitality Management, 13(2), 79–85.
Chi, C. G. Q., & Qu, H. (2008). Examining the structural relationships of destination image, tourist satisfaction and destination loyalty: An integrated approach. Tourism management, 29(4), 624-636.
Choo, H., & Petrick, J. F. (2012). Comparison between first‐timers and repeaters for relationship marketing implications. International Journal of Tourism Research, 14(3), 298-302.
Cooper, C. 2004: World Trade Law, Culture, Heritage and Tourism. Towards a Holistic Conceptual Approach, Current Issues in Tourism, 7(4), 383-398.
Cossío-Silva, F.-J., Revilla-Camacho, M.-A., & Vega-Vázquez, M. (2019). The tourist loyalty index: A new indicator for measuring tourist destination loyalty? Journal of Innovation & Knowledge, 4(2), 71-77.
Dann, G. (2012): Tourist Motivation and Quality-of-Life: in Search of the Missing Link. In Sirgy, J. (Eds.). Handbook of tourism and Quality-of-Life Research. Enhancing the lives of tourist and residents of host communities. London: Springer Press.
Dougan, J. W. (2007). Analysis of Japanese Tourist Demand to Guam. Asia Pacific Journal of Tourism Research, 12(2), 79-88.
Dritsakis, N. (2007). An Econometric Model of Tourist Demand An Econometric Model of Tourist Demand: The Case of Greece. Journal of Hospitality & Leisure Marketing 7(2), 39-49.
Dunkley, R., Morgan, N., & Westwood, S. (2011). Visiting the trenches: Exploring meanings and motivations in battlefield tourism. Tourism management, 32(4), 860-868.
Edwards, D., & Griffin, T. (2013). Understanding tourists’ spatial behaviour: GPS tracking as an aid to sustainable destination management. Journal of Sustainable Tourism, 21(4), 580-595.
Fakeye, P. C., & Crompton, J. L. (1991). Image Differences between Prospective, First-Time, and Repeat Visitors to the Lower Rio Grande Valley. Journal of Travel Research. 30(2), 10-16.
Fakeye, P. C., & Crompton, J. L. (1992). Importance of socialization to repeat visitation. Annals of Tourism Research, 19(2), 364-367.
Fallon, P. & Schofield, P. (2003). First-timer versus repeat visitor satisfaction: the case of Orlando, Florida. Tourism Analysis, 8(2-4), 205-210.
George, R. & Booyens, I. (2014). Tourism Demand: Tourists’ Perceptions of Safety and Security. Urban Forum, 25(4), 449-467.
George, W., Mair, H., & Reid, D. (2009). Rural Tourism Development. Localism and Cultural Change. Bristol: Chanel View Publications.
Gill, A. (1998). Local and resort development. In Butler, R., Hall. M., & Jenkins, J. (Eds). Tourism and Recreation in Rural Areas. Chichester: John Wiley & Sons.
Gitelson, R.J. & Crompton, J.L. 1984. ‘Insights into the repeat vacation phenomenon’, Annals of Tourism Research, 11(2): 199–217.
González, E.A., Conde E.M. (2011). Procedimiento para medir la demanda turística en un destino. TURyDES, 4(11). Retrieved from http://www.eumed.net/rev/turydes/11/gacp.html
Hämäläinen, S. (2005). Optimal Commodity Taxes with Tourist Demand. International Advances in Economic Research, 11(1), 121-122.
Hernández, L., Solís, M. M., Moliner, M. A. & Sánchez, J. (2006). Tourism Destination Image, Satisfaction and Loyalty: A Study in Ixtapa-Zihuatanejo, Mexico. Tourism Geographies: An International Journal of Tourism Space, Place and Environment, 8(4), 343-358.
Hughes, M. & Morrison-Saunders, A. (2002). ‘Repeat and first time visitation in an experience specific context: the Valley of the Giants tree top walk’, Journal of Tourism Studies, 13(1): 20–25.
Juaneda, C. (1996). Estimating the probability of return visits using a survey of tourist expenditure in the Balearic Islands, Tourism Economics, 2, 339-352.
Kemperman, A., Joh, C.H. & Timmermans, H.J.P. 2004. ‘Comparing first-time and repeat visitors activity patterns’, Tourism Analysis, 8(2–4): 150–164.
Kim, S. H., Holland, S., & Han, H. S. (2013). A structural model for examining how destination image, perceived value, and service quality affect destination loyalty: A case study of Orlando. International Journal of Tourism Research, 15(4), 313-328.
Kozak, M., Bigné, E., & Andreu, L. (2005). Satisfaction and destination loyalty: A comparison between non-repeat and repeat tourists. Journal of Quality Assurance in Hospitality & Tourism, 5(1), 43-59.
INE (2017a). Encuesta de ocupación hotelera. Retrieved July 03, 2018, from: http://www.ine.es/.
INE (2017b). Encuesta de ocupación en campings. Retrieved July 03, 2018, from: http://www.ine.es/.
INE (2018a). Estadística de movimientos turísticos en frontera. Frontur. Retrieved September 22, 2018, from: http://www.ine.es/.
INE (2018b). Encuesta de turismo de residentes. Retrieved September 22, 2018, from: http://www.ine.es/.
INE (2018c). Explotación estadística del directorio central de empresas. DIRCE. Retrieved September 23, 2018, from: http://www.ine.es/.
Kemperman, A. D. A. M., Joh, C. H., & Timmermans, H. J. P. (2003). Comparing first-time and repeat visitors activity patterns. Tourism Analysis, 8(2-4), 159-164.
Kruger, M., Saayman, M., & Ellis, S. M. (2010). Does loyalty pay? First-time versus repeat visitors at a national arts festival. South African Business Review, 14(1), 79-104.
Lau, L.S. & McKercher, B. (2004). Exploration Versus Consumption: A Comparison of First-Time and Repeat Tourists. Journal of Travel Research, 42(3), 279-285.
Lehto, X. Y., Cai, L., O´Leary, J., & Huan, T.C. (2004). Tourist shopping preferences and expenditure behaviours: The case of the Taiwanese outbound market. Journal of Vacation Marketing, 10(4), 320-332.
Lew, A., & McKercher, B. (2006). Modeling Tourist Movements: A Local Destination Analysis. Annals of Tourism Research, 33, 2, 403-423.
Li, X. R., Cheng, C. K., Kim, H., & Petrick, J. F. (2008). A systematic comparison of first-time and repeat visitors via a two-phase online survey. Tourism Management, 29(2), 278-293.
Loureiro, S. M. C., & Kastenholz, E. (2011). Corporate reputation, satisfaction, delight, and loyalty towards rural lodging units in Portugal. International Journal of Hospitality Management, 30(3), 575-583.
McKercher, B., Denizci-Guillet, B., & Ng, E. (2012a). Rethinking Loyalty. Annals of Tourism Research, 39(2), 708-734.
McKercher, B., Shoval, N., Ng, E., & Birenboim, A. (2012b). First and repeat visitor behaviour: GPS tracking and GIS analysis in Hong Kong. Tourism Geographies, 14(1), 147-161.
McLaren, D. (2010). Rethinking Tourism in Bohn, S. (2010). Tourist and Tourism. A Reader. Long Grove: Waveland Press.
Okamura, K., & Fukushige, M. (2010). Differences in travel objectives between first-time and repeat tourists: An empirical analysis for the Kansai area in Japan. International Journal of Tourism Research, 12(6), 647-664.
Okubo, A., Higuchi, Y., & Takeyasu, K. (2017). Hypothesis Testing for the Questionnaire Investigation on Tourists’ Behaviour. International Business Research, 10(12), 68-79.
Oppermann, M. (1997). First-time and repeat visitors to New Zealand. Tourism Management, 18(3), 177-181.
Oppermann, M. (1998). Destination Thresholds Potential and the Law of Repeat Visitation, Journal of Travel Research, 37(2), 131-137.
Oppermann, M. (2000). Tourism Destination Loyalty. Journal of Travel Research, 39(1), 78-84.
Özdemir, C., & Yolal M. (2017). Cross-cultural tourist behaviour: An examination of tourists behaviour in guided tours. Tourism and Hospitality Research, 17(3), 314-324.
Pereda, M. H. (2002). Repeat Visitors of a Tourist Destination. Journal of Tourism Research, 36(1), 35-43.
Petrick, J. (2004). First Timers’ and Repeaters’ Perceived Value. Journal of Travel Research, 43(1), 29-38.
Potocka, I. & Zajadacz, A. (2009). Weather and climate as elements of tourism space controlling the demand for and forms of tourist activity. Quaestiones Geographicae, 28, 53-64.
Puah, C., Fung-Thai, T., Arip. M. A. (2014). Singaporean demand for tourism in Malaysia, Economic Annals-XXI, 11-12, 32-36.
Reid, L. J. & Reid, S.D. (1993). Communicating Tourism Supplier Ser- vices: Building Repeat Visitor Relationships. Journal of Travel & Tourism Marketing, 2,2/3, 3-20.
Reisinger, Y. (2009). International Tourism: Cultures and Behavior. Elsevier & Butterworth-Heinemann.
Richards, G. (2018). Cultural Tourism: A review of recent research and trends. Journal of Hospitality and Tourism Management. 36, 12-21.
Rojas, D. (2014). Un modelo teórico de reasignación de recursos ante un shock de demanda turística. Revista de ciencias económicas, 32(1), 25-42.
Sala, M., Farré, M., & Torres, T. (2014). La demanda turística de la economía española: caracterización cíclica y sincronización. Cuadernos de Turismo, 33, 335-356.
Sariego, I. & Mazarrasa, K. (2017): Explorando la experiencia turística en Cantabria: Análisis del comportamiento de la demanda. International Journal of Scientific Management and Tourism, 3-4, 419-430.
Schubert, S. F., Brida, J. G., & Risso, W. A. (2011). The impacts of international tourism demand on economic growth of small economies dependent on tourism. Tourism Management, 32(2), 377-385.
Seetanah, B. (2011). Assessing the dynamic economic impact of tourism for island economies. Annals of Tourism Research, 38(1), 291-308.
Shaw, G., & Williams, A. (2004). Tourism and Tourism spaces. London: SAGE Publications
Tisdell, C.A. (2017). Financial implications of seasonal variability in demand for tourism services. Journal of Management Information and Decision Sciences, 20, Special Issue, 1-12.
Tussyadiah, I., Zach, F. (2012). The Role of Geo-Based Technology in Place Experiences. Annals of Tourism Research, 39(2), 780–800.
Üner, M. & Armutlu, C. (2012). Understanding the Antecedents of Destination Identification: Linkage Between Perceived Quality-of-Life, Self-Congruity, and Destination Identification. In Uysal, M., Perdue, R. R., & Sirgy, M. J. (2012). Handbook of tourism and quality-of-life research: enhancing the lives of tourists and residents of host communities. Dordrecht: Springe
Yoon, Y., & Uysal, M. (2005). An examination of the effects of motivation and satisfaction on destination loyalty: A structural model. Tourism Management, 26(1), 45–56.
Xia, J. (2007) Modelling the spatial-temporal movement of tourists. PhD Thesis, RMIT. University, Australia.
Xia, J., Zeephongsekul, P., & Packer, D. (2011) Spatial and temporal modelling of tourist movements using Semi-Markov processes. Tourism Management, 32(4): 844–851.
Xu, J. & Sun, M. (2015) Research on the Tourist Demands and Evaluation for Public Tourism Services, in: Zeng G. (Eds) Tourism and Hospitality Development Between China and EU. Berlin Heidelberg: Springer.
1. Associate Professor. Escuela de Turismo Altamira. Universidad de Cantabria (Spain). Email: isariego@euturismoaltamira.com
2. Associate Professor. Department. Universidad Europea de Madrid (Spain). Email: alberto.moreno@universidadeuropea.es
3. Associate Professor. Department of Statistics and Econometrics. Universidad de Córdoba (Spain). Email: d52gagam@uco.es
[Index]
revistaespacios.com

This work is under a Creative Commons Attribution-
NonCommercial 4.0 International License