Espacios. Vol. 36 (Nº 10) Año 2015. Pág. 16
Comparison of Pricing Models of Options over Futures Contracts for the Colombian Electricity Market
Comparación de Modelos de precios de Opciones sobre Contratos a Futuro para el Mercado Eléctrico Colombiano
Santiago MEDINA Hurtado 1; Jorge Aníbal RESTREPO 2; Lilliam URREGO Agudelo 3; Frédéric HÉLIODORE 4
Recibido: 08/02/15 • Aprobado: 17/03/2015
Contenido
3. Options Pricing and Results
ABSTRACT: |
RESUMEN: |
1. Introdução
The Colombian electricity market structure is the result of a long process of government intervention that began in the 1930's. In the old regime, state companies held monopolistic power over the energy sector, and provided generation, transmission and distribution services in a centralized way, with a vertical integration. In the 1980's, the Colombian electric sector, like that of other Latin-American countries, went into a crisis. The main cause was rates subsidy and the politicization of state companies, which resulted in a deficient performance of service. The efficiency of state monopolies to provide public services was questioned in worldwide. This was the origin of great reforms in some countries such as Great Britain, Norway and Chile.
At the beginning of the 90's, the need for modernizing the Colombian electric sector was proposed and it was done through a similar plan used by the pioneer countries in this sector, especially Great Britain in order to achieve. the following goals:
- Introduce the competition into the electric sector
- Allowing private investment and the privatization of state companies
- Eliminate the vertical integration, dividing the services of transmission, distribution and generation into separate businesses
- The state only has the regulatory role
The restructuring of Colombian electric sector began in 1994 with the laws 142 (Public Services law) and 143 (Electricity law). These acts created the reference framework for development the electricity market and allowed define the institutions, the organizational structure, the agent involved, and the operative mechanisms that promote healthy competition and market development.
In the current wholesale energy market the agents negotiate electricity by means of bilateral contracts of purchase and sale or through the Energy Exchange. In the first case, the agents agree directly or convocations between the price, volume and deadline in order to ensure the energy price of medium and long term to cover their demand. In the second case, the agents are exposed to the price volatility of Energy Exchange. There is currently a wide variety of bilateral contracts, the most common are the following:
- Take or Pay Contracts (ToP) with or without price limits.
- Take and Pay (TaP)
- Pay the Generated Contracts (CPLD)
- Take or Pay Contracts with floor and ceiling
- Combinations of contracts above
The heterogeneous of contracts have some drawbacks which affect the market development as following:
- The liquidation process of contracts is complex.
- Currently, a high percentage of the system's demand (about 85%) is agreed through contracts.
- Low standardization and homogenization of contracts limit the subsequent negotiation (low liquidity).
- The lack of anonymity between the parties causes unequal conditions between the agents. Prices depend on the chosen and identified counterparty.
- The information about agreed prices in market is not available in real time.
- The prices for the regulated sector are systematically higher than the non-regulated sector.
Nevertheless the Contracts are a hedging strategy of price variations risk (volatility) in long term, but regarding the spot prices (short-term) the market regulator consider that is necessary development the market to improve aspects mentioned before. Likewise, this would allow agents to enter the market on equal terms, into a standardized and transparent activity commercial. In order to meet these goals some resolution projects have been proposed: initially, the document CREG 031 of 2005 (SEC- Contracting Electronic System), and the document CREG 090 of 2011 (MOR - Regulated Organized Market).
Even though resolution CREG 031 of 2005 did not prosper, it proposed developing an online trade mechanism named Standardized Bilateral Contract System based internet, managed and operated by the Trade Exchanges System Manager (ASIC), and it allowed trading futures and options contracts which are common in financial markets. The futures contracts type ToP with standard parameters of energy amounts, execution time and duration. On SEC, it was possible trading the following contracts of sell or buy energy:
- Monthly Futures Contract (FC-month)
- Semester Futures Contract (FC-semester)
On the other hand, it was possible trading CALL or PUT options monthly with either underlying the futures contracts (ToP) or the spot price in order to manage the risk of exposure to Energy Exchange and hedging the differences between commercial demand and contracting levels with respect to the daily load curve. According to behavior of prices in relation with the strike price, the buyer has the possibility of execute the option. For example, in an option contracts over futures the buyer has the right, but not the obligation, to get a ToP contract (CF-month) at the strike price if the price of the underlying asset (futures price) is higher than the strike price. The following contracts could be trading:
- CALL or PUT options monthly over futures contracts ToP
- CALL or PUT options monthly over the spot price
On the other hand, the resolution CREG 090-2011 proposes developing a transaction mechanism named Regulated Organized Market —MOR— different from SEC. This resolution project does not define options contract over futures, but it propose another flexibility alternative as transactions hedging mechanisms in the energy market, manage the exposure to the exchange price, and standardization of the market. MOR propose the market standardization of future contracts in order to guarantee the supply of energy of regulated and non-regulated demand. The contracting process is formalized through the auction between buyers and sellers carried out by the ASIC. In addition, it proposes the creation of a secondary market where both buying and selling agents may partially or totally transfer the obligations arising from the sale in MOR.
In this job, we analyzed the valuation model of options over futures proposed in resolution CREG 031-2005 (SEC). The model Black and Scholes 76was proposed to evaluate the premiums without taking account the peculiarities of the underlying asset (futures price or spot price) in the Colombian electricity market. In this paper, we evaluate the premium of CALL option over futures and take as underlying the contract prices, to do this, we use several options pricing models to compare the result obtained with the Black and Scholes 76 model which is used frequently in other energy markets and verify whether it produces an adequate premium value. This paper is organized as follows, in Section 2, we develop the theoretical framework of options valuation model. In Section 3, we present the premium valuation of a CALL option with underlying contract prices. Finally, in Section 4 we present the conclusions.
2. Theoretical Framework
An increasing amount of countries around the world, including Colombia, launched restructuring projects in the electricity sector. Even though the speed and scope of these reforms vary from country to country, this liberalization process is based on opening the electricity market to competition. The deregulation process has evolved side-by-side with the introduction of a wholesale competitive electricity market with energy derivative contracts. Thus, a portfolio of commercial alternatives is provided, so that agents negotiate electricity needs to cover demand.
The characteristics of underlying assets in energy derivative contracts are particular and different from the derivatives negotiated in financial markets. Such characteristics may be expressed in statistics form as excess kurtosis, biases, presence of extreme values, and heteroscedasticity. These characteristics must be treated explicitly in the options pricing models. However, the models used for valuate energetic derivatives based on the stochastic differential equation proposed by Black and Scholes has assumptions about the behavior of the underlying asset, such as normality and constant volatility. These could be observed in financial markets, but they are not true for energetic markets.
The number of papers that deal specifically with the problem of pricing energy derivatives is high. Some papers point out general characteristics in the behavior of energy prices, and how they should be considered in order to evaluate the pricing derivatives. Several papers argue that an electricity pricing model must incorporate a heteroscedastic model, and the possibility for jumps in prices (Kaminski, 1997; Eydeland and German, 1999; Deng, 2000; Weron, 2006; Seifert and Uhrig-Homburg, 2006). Other papers, on the contrary, emphasize the importance of seasonal behavior of electricity prices, and the process of mean reversion (Pilipovic, 1998). However, empirical work is still needed to characterize energetic derivatives; therefore, the research outlook for electricity spot price modeling and valuate the derivative price is quite wide. This is due to the specific characteristics of electricity as product to be negotiated, and to the fact that competitive electricity markets and electricity derivatives negotiation are relatively new. Consequently, there is not a long history of spot prices or prices of derivative products in many markets. In the United States, futures and options contracts were recently included in the Chicago Board Of Trade, the New York Mercantile Exchange, and the Minneapolis Grain Exchange.
Other research deal with the subject of the relation among variables that determine electricity spot price behavior, and their implications in the value of energy derivatives (Lucia and Schawartz, 2002). In these papers, it is considered that the price of derivatives is the discount to a rate adjusted to the risk of contingent payments expected from electricity. However, these payments largely depend of future prices of electricity, which in turn, largely depend on other variables, which must be taken into account when modeling price expectations as basis of derivative pricing products. In fact, systematic behaviors of electricity prices may be attributed to changes in demand patterns as a consequence of economic activity periods, or seasonal behaviors in weather conditions. In general, many studies have been made with the information provided by the world's oldest electricity market as Nord Pool ASA. This electricity market was the result of the electricity sector liberalization in Nordic countries; such process began in Norway in 1991, then Sweden 1996; Finland 1998; and eastern Denmark, in 1999. This market relies on a history of spot prices and derivatives contracts. This market has shown important growth in the trading volume (García and Palacios, 2006).
The evolution of underlying asset prices (spot price or contract price), expiration time, volatility and interest rates level, seasonality, etc. should be analyzed beforehand in order to incorporate this information into options pricing assessment models. Studies on spot price behavior in the Colombian market have been reported in literature; however, attempts to characterize derivative prices, futures or options contracts are rare. (Cartea and Figueroa, 2005; Salazar and Pantoja, 2011).
From the viewpoint of options pricing modeling, since Black and Scholes published their paper in 1973, there has been great interest in refining their model, and identifying differences between the prices calculated with this model and prices observed in financial markets. In energy markets, some suggestions have been made and empirical research has been carried out basically for the Nordic, American and English markets.
The valuation of the options pricing in energy markets currently takes place through alternative techniques because the product negotiated has particular characteristics. They make it different from the products negotiated in financial markets or commodities markets. In this regard, options pricing modeling based on the Black-Scholes equation (BS) cannot be applied directly for assessing premiums of derivatives. Alternative methods must be applied, such as models based on binomial trees, the Monte Carlo simulation, or variations of the BS model that make the assumptions more flexible. Currently there are not a general options pricing model for the electricity sector and the researchers propose several methodological approaches (Deng et al, 2001; German and Roncoroni, 2006; Woo et al 2001).
The assumption inherent in the BS model is that underlying asset prices are lognormal, that is the asset return rate is continuous and normal in any time interval. Options pricing tests often show that Options In the Money [5] and/or Out the Money [6] have worse pricing by the BS model than the options At the Money [7]. That is, the volatility for which the BS model valuate correctly the options prices At the Money causes wrong pricing for options In the Money and Out of the Money (Hull, 2009). These biases in pricing may be attributed to the differences between the lognormal distribution assumed in the BS model and the correct distribution of the underlying asset. Following we present different models to assessing the options premium.
-
2.1. Black 76 Model
This model is derived from BS options pricing model when the underlying asset is a future contract with a deadline or expiration time, It maintains the assumption about the lognormality price. Its use is justified because it is very easy to implement. The resolution CREG 031, established this model as option valuation model en the Colombian market.
Premium for the CALL option on futures contract on SEC:
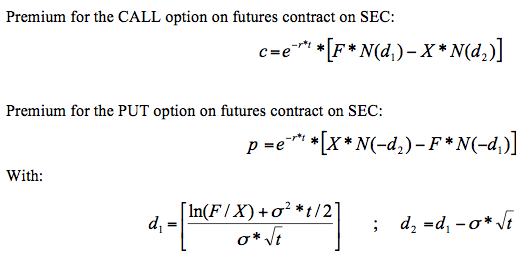
Where:
c: Premium of CALL option
p: Premium of PUT option
r: Risk-free interest rate expressed as an annual continuous compound rate.
T: expiration time, Fraction of remaining year at deadline (basis: 1 year = 365 days)
F: Price of the futures contract
X: strike price or option exercise price
σ: Annualized implied volatility of the futures contract
N(x): Normal Cumulative probability distribution function with mean 0 and standard deviation 1
-
2.2. Binomial Trees
This method is based on assuming that the underlying asset price presents a random walk behavior made up of a great number of small binomial movements. Binomial is taken to mean a moment in the future when an asset price can only take two values. For options pricing, the tree diagram represents the potential trajectory of the underlying futures contract prices during the option's life-span (Hull, 2009).
An initial futures price is considered (F0), and it is believed that it will rise to (F0u) with associated probability P and growth with factor u (with u>1), or it will fall to F0d with associated probability (1-P) and decay with factor d (with d<1) throughout a period T (option's deadline). If the price rises, it is supposed that the option payment is fu , and if it falls, fd, as shown in Figure 1.
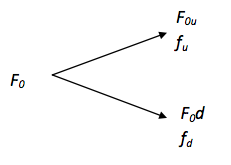
Figure 1. Binomial Tree
For assessment the risk-neutral valuation principle is considered, It states that a derivative may be valued supposing that the world is risk-neutral. That is, for valued purposes, market agents expect performance equivalent to the risk-free rate, and payments expected from the derivative are deducted using this rate. If, in addition, we consider a risk-free portfolio made up of a short position on the option, combined with a long position in ∆ futures contracts, we have the following:

Then, replacing ∆ and working out the value of f, the option price today will be:
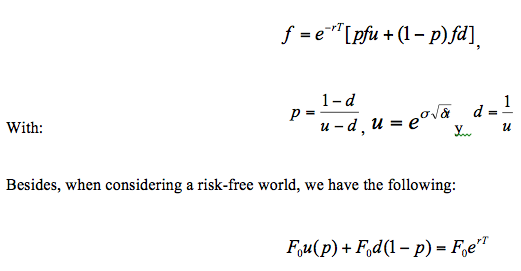
For American options on futures, a multi-step binomial tree may be used. Figure 2.

Figure 2. Binomial Tree of Multiple Periods
For valuate options on futures contract, the models Black 76 and binomial trees are commonly used mainly for their simplicity and worldwide acceptance. These models require that forward prices meet the assumptions necessary for their implementation and this is why other pricing approaches are needed in order to compare results. In the variety of alternative methods, we have the Monte Carlo simulation, trinomial trees, and the jump diffusion model as the most widely accepted.
-
2.3. Trinomial Trees
Trinomial trees are other valuation alternative. Besides having a rise probability (Pu) and fall probability (Pd), they have the probability of continuing in the same value (Pm). These are:
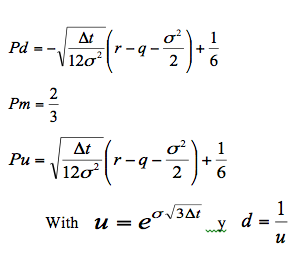
Where ![]() = time interval length, q= dividend payment rate and r= risk-free interest rate
= time interval length, q= dividend payment rate and r= risk-free interest rate
The alculations for a trinomial tree are similar tree. Just like a binomial tree, it must be worked from the end to the beginningn each node the exercise price and the continuity value are calculatedthe price option will be:
![]()
Where fu, fm and fd are the option values for the rise, middle and fall sequences, respectively, as indicated in Figure 3.
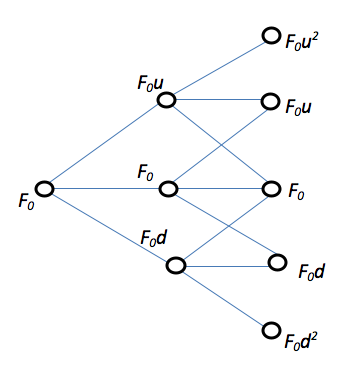
Figure 3. Trinomial Tree
The trinomial trees are more complex to implement, however they are more efficient and converge faster than binomial trees.
-
2.4. Monte Carlo Simulation
The Monte Carlo simulation uses the result of risk-neutral valuation. Random walks of prices are built using a stochastic process of underlying assets, this enable us generate the probability distribution function of expected benefits in a time period. Then, it is calculated the present value using the risk-free rate as shown below:
- Identify the stochastic process of underlying assets as geometric Brownian motion, a longnormal model with mean reversion, etc. The better selecting model is achieved by calculating the forecast error using the historical series.
- A random walk of Prices is created in a risk-neutral world for the option's maturity period - SN.
- The option's payment flow is calculated as max(0, SN-X), where SN= futures price simulated, and X= strike price or option exercise price.
- Steps II and III are repeated to get the probability distribution function of payments flow.
- The mean of payments flow is calculated to get an estimate of the expected benefit in a risk-neutral world.
- The present value of expected benefit is calculated at the risk-free rate to get an estimated value of the option.
Suppose that the stochastic process followed by the yield of underlying assets is a geometric Brownian motion:
![]()
Where dP is the price change between two periods, dW is a Wiener process, u is the yield expected in a risk-neutral world, and σ is volatility. To simulate the path followed by the price P, we can divide the derivative's life into N smaller intervals of length ∆t. Thus, in discrete terms, the equation approximates:

The relation above is basically the yields of the price series for ∆t. We may use this expression as a prices dynamic model by writing:

Where ε is N (0.1). Both μ and σ are characterized based on the yields of prices time series. The simplest case implies that μ=0 and σ=constant.
If mean reversion behavior is spotted, not in the asset prices time serie, but in the yields, we may use a Longnormal stochastic model with mean reversion, whose dynamics is given by the following differential equation:

Where: β=mean reversion rate, mean value around which the yield evolves, α=mean reversion speed, it reduces the tendency to retrieve the mean value, γ=weighting of the random component or volatility of the risk factor, and ε=random component N (0.1).
The selection between stochastic processes is realized quantifying the forecast error of each model using the historic time series.
-
2.5. Jump Diffusion Model
The financial stochastic models to assess derivatives are often adapted to assess derivatives in other markets as in energy markets. To explain the price dynamics of financial assets, the best known model is the geometric Brownian motion (GBM). However, it cannot be directly applied to electricity prices because it does not consider factors such as the presence of peaks in the price series, mean reversion or dynamic volatility. The first approaches that incorporated modifications to the GBM model with the characteristics mentioned above were proposed by Kaminski (1997). The specification of general jump diffusion model entails a Stochastic Differential Equation (SDE) that regulates the dynamics of the process price.
![]()
The Brownian motion Wt is responsible for the small fluctuations (around the mean in the long run for the mean reversion process), and the pure jump process q(Pt, t) generates big jumps that are not frequent (upward). The last term is a compound Poisson process with frequency and severity, generally independent of Wt. The term of the trend (drift) μ(Pt,t) may be modeled as a stochastic process or deterministically using the mean of long-term as a constant rate. On the other hand, in order to simplify the model the volatility term σ(Pt,t) is often established as a constant, even though empirical evidence suggests that electricity prices present heteroscedasticity.
The jump diffusion model is essentially developed by adding a the components, d.q(t) to a standard GBM. q(Pt, t) is a Homogeneous Poisson Process (HPP) with frequency (λ) and Severity (d), as normal logarithmic distribution it is a compound Poisson process. The main drawback is that it does not consider another fundamental feature of electricity prices known as mean reversion of the price regime, or return to "normality". If prices rise, GBM assumes that the new price level is a normal event, produced randomly through a continuous diffusion process, dWt. It does not consider the previous price level, or the possibility of returning to the previous price level. However, practically all market agents agree that it is very likely that prices will finally return to their "normal" level once the weather phenomenon, or the event that caused the rise is over.
In a comparative study, Johnson and Barz (1999) evaluated the efficiency of some kinds of diffusion models to describe the evolution of electricity spot prices in several markets. They conclude that diffusion models with jumps applied to the geometric mean reversion model provided the highest performance, and models without jumps were inadequate to model electricity prices.
The asymmetries are another problem which must to be dealt. That is, when electricity prices go through a big jump (peak), they tend to go back to their mean level much faster than when they go through small jumps. Several authors deal with jumps in a symmetrical way (Johnson and Barz, 1999). As a consequence, the mean reversion rate is overrated for normal price regimes. Geman and Roncoroni (2006) suggested using the mean reversion model, along with the modeling of upward and downward jumps. Weron et al. (2004) stated that a positive jump must always be followed by a negative jump of (approximately) the same size that captures the quick decrease of electricity prices after a jump. When daily mean prices are analyzed, this approach seems to be a good approximation, due the peaks generally not last more than a day.
Another limitation of the jump diffusion process with mean reversion is the assumption that the diffusion process is independent of the Poisson component, this is not true for the electricity. It is not very likely that prices will rise during the night when demand and prices are low. To deal with this problem, Eydeland and Geman (1999) formulate a model where the size of the jump is proportional to the current price. As a result, jumps tend to be more severe during high-price periods.
Empirical data also suggest that the homogeneous Poisson process cannot be the best option to model the jump component. In some cases, price rises take place in a given season (existence of seasonality). They generally take place in very specific periods, for example, Christmas. For this reason, Weron (2006) has considered the use of a Non-Homogeneous Poisson Process (NHPP) with a periodic deterministic intensity function, instead of an HPP with a constant intensity rate.
The process of filtering the series peaks and calculating the price of the CALL option is indicated below:
- Calculate the logarithmic yields of the price series Ln (P t/Pt-1), calculate the mean μ and standard deviation σ.
- Identify the jumps based in a criterion. Generally, a peak is considered if the yield is above RT=±2.5σ or RT=±3σ.
- A new series is obtained by replacing the price associated with the peak by the average between the prices before and after the peak.
- Processes ii and iii are repeated for the new series until all the prices are within the range ±2.5σ or ±3σ.
- Quantify the magnitude of all peaks identified as Rpt-RTt where Rpt is the yield in time t and RT is the yield threshold. The data magnitude permit identify the probability distribution function (d).
- Quantify the parameter λ for frequency jumps as =Np/N, where Np is the number of picks identified and N is the number of days in time serie. We assume a homogenous Poisson process with parameter λ.
- In order to forecast a futures price for a given period of time, a stochastic process with jumps is used in a GBM or lognormal with mean reversion.
- The CALL option price is calculated using the Monte Carlo simulation.
2.6. Volatility Model. Exponentially-Weighted Moving Average (EWMA)
The EWMA model is used by the bank JP-Morgan for measuring market risk. It is a model easy to apply which quickly captures regime changes in a time series. That is, it quickly captures strong variations of the prices in markets because of it´s weighting method of observations, therefore, it is possible generate better forecasting in high volatility periods. This is a dynamic method that grants more weight to final observations than the initial observations.
The calculation must begin with historical volatility assuming that the mean is zero, each squared yield have a specific weight as is indicated:
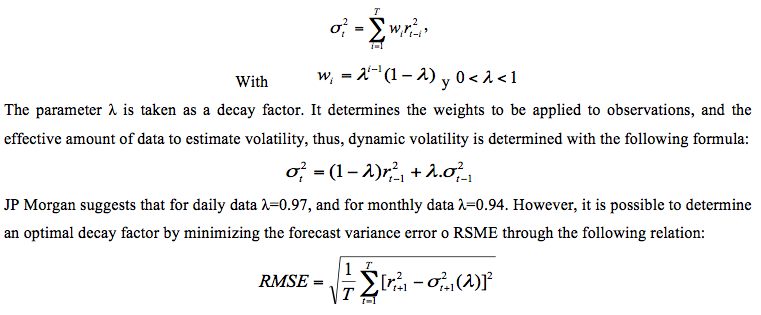
The stochastic process used to assess the options, will be modified in order to include the dynamic volatility model.
3. Options Pricing and Results
Based on the price series of contracts negotiated in the Colombian electricity market from January, 1997 until October, 2008, a comparative study is developed for pricing energy options on futures contracts, whose underlying asset is the price of the contracts. In the first stage, the most convenient volatility model is adjusted according to the characteristics of the series. Then, all methods to evaluate the options values will be applied. Figure 4 shows spot prices and energy contract prices in the Colombian market.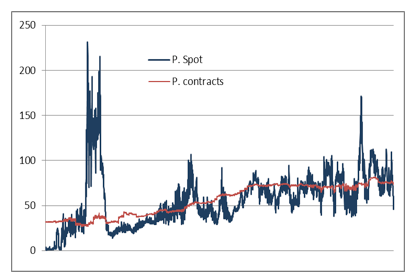
Figure 4. Spot and Energy Contract Prices
Initially, the assumptions of equality between arithmetic and logarithmic performance were verified for the price series of the energy contracts (forward contracts):
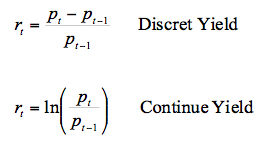
Generally, it is assumed that the logarithmic yield is normal, and the prices have a lognormal behavior. However, Figure 5 shows that the logarithmic yield distribution has excess kurtosis and heavy tails. Jarque-Bera and Kolmogorov-Smirnov normality tests for the logarithmic yield were rejected.
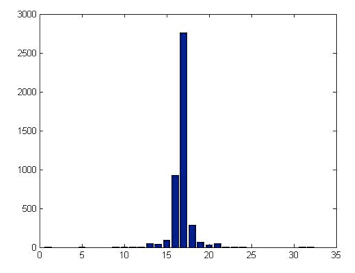
Figure 5. Distribution of Contract Price Logarithmic Performance
This analysis is important because it shows differences in average yield or its volatility. Generally, the model used for calculating yields is the logarithmic model because it makes possible to carry out approximations of yield and volatility for different periods of time. As shown in the following table, the values obtained for logarithmic yields are lower than the obtained using arithmetic yields. The consequence of this difference is that, if yield is calculated for m-days (for example, a month or a year), the value may be underrated, similarly, the volatility can be underrated. For the case of yield volatility daily, the results obtained are similar. This characteristic is associated to the fact that there are no abrupt price changes, and the time window analyzed is short (daily). Table I.
Table I. Logarithmic Performance Vs Arithmetic Performance of the Contract Price
|
Logarithmic yields |
Arithmetic yields |
Average yield Daily |
0.0234% |
0.03455% |
Yield Volatility Daily |
1.49022% |
1.49950% |
3.1. Volatility Analysis of Forward Prices
The optimal lambda value (λ = 0.987218891) for a EWMA model of daily yields, was based on the variance forecast and the error minimization (RMSE). The EWMA volatility model for the daily yields is given by:
![]()
The average volatility of yield daily using the model EWMA is 1.24%, this value is lower than the historical volatility previously calculated (1.49%). The model permit calculate the volatility for longer periods of time.
It is possible also to see the adjustment of EWMA model to logarithmic yields daily when charting the model limits for the desired confidence level. The 99% confidence limits of are shown in Figure 6.
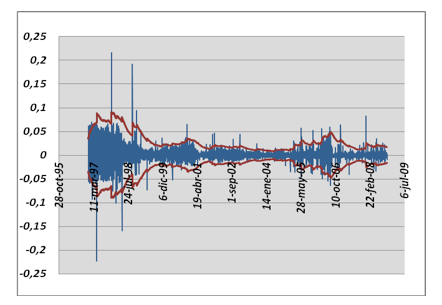
Figure 6. Volatility of Daily Logarithmic Performance Limits
Because the options and futures energy contracts can be negotiated generally at six-month or one-year ahead, it is necessary to use a six-month, or annual volatility in order to evaluate the options value.. It is necessary to verify whether the yield or volatility for longer periods of time and these can be calculated using the following relations:

The previous relations are true if the prices be distributed in a lognormal way, and the logarithmic yields are normal. The previous relations were applied to obtain annual performance and volatility based on daily performance. The following results are obtained:

When calculating volatility and the average yield taking an annual base, the averages should be similar to values found previously. However, as it can be observed, that such values are very different from these obtained, as shown in Table II:
Table II. Logarithmic yields Vs Arithmetic yields of the Contract Price base annual

The most critical case is obtained for the annual volatility estimated of 23.69% based on daily volatility (using the theoretical relation![]() ). However, by using time series of annual yields, we obtained 7.71% as annual volatility. This is a critical situation in the analyses because volatility is a critical parameter in measuring risks or assets valuation. In our case, the theoric model overestimate the volatility with a important impact in the value of option contracts.
). However, by using time series of annual yields, we obtained 7.71% as annual volatility. This is a critical situation in the analyses because volatility is a critical parameter in measuring risks or assets valuation. In our case, the theoric model overestimate the volatility with a important impact in the value of option contracts.
The determination of the optimal lambda value (λ = 0.883638962) for a EWMA model of annual yields, was based on the variance forecast and the error minimization. The annual volatility model for annual yields is given by:

The result obtained for the annual average yield is 9.21%, and for the annual volatility is 11.01%. The theoretical average volatility obtained this way is different from the historical volatility previously calculated (7.71%). However, it is more closely adjusted to real data, and it is safer to use it in options pricing models.
As can be observed throughout along the exposure, the assumptions used in the models are not true for time series of energy contract. For this reason, it is necessary to adjust the financial models by incorporating the statistical characteristics, looking obtain more adequate models in tune with reality for their use in risk and valuation analyses.
3.2. Energy Options Pricing
For comparing the models of option valuations a hypothetical CALL option over a future contract ToP at one year will be used with underlying contract price based on the assumptions parameters shown in Table III:
Table III Parameters Used for CALL Option on Futures
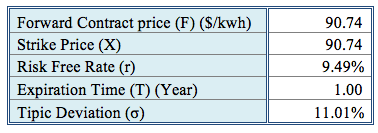
3.1.1. Black 76
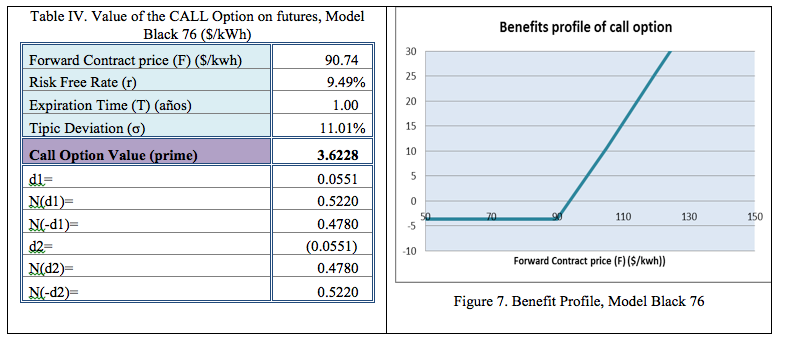
This model works with the relations presented in number 2.1. The results are shown in Table IV. Figure 7 shows the benefit profile of the CALL option.
3.2.2. Binomial Trees
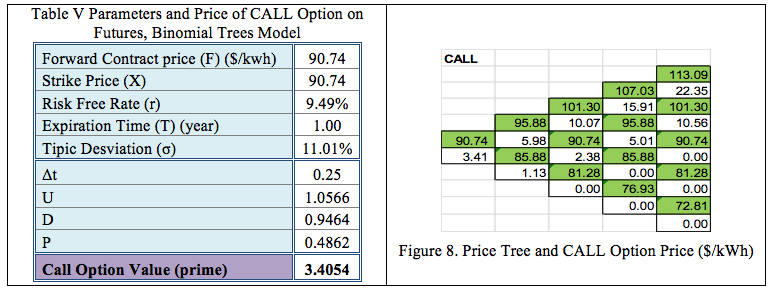
This model works with the relations presented in number 2.2. The results are shown in Table V, and Figure 8 shows the price tree, and the options price for four steps:
3.2.3. Trinomial Trees
In our case, we assume that the dividend payment rate q is equal to the risk-free rate r. This model works with the relations presented in number 2.3. The results are shown in Table VI, and Figure 9 shows the price tree, and the options price for the four steps:

3.2.4. Monte Carlo Simulation Model
For the Monte Carlo simulation process two stochastic models were tested: the Lognormal Model with Mean Reversion (LOG MR), and the Geometric Brownian Motion (GBM). The adjustments of both models at daily data of yields are shown in the table below:
-
RMSE
MAPE
LOG MR
0,86315
0,01116
GBM
1,01644
0,01347
LOG MR model produces a better adjustment to the price series. For this reason, this model was used for the Monte Carlo simulation processes in order of quantify the price of CALL options. The volatility model EWMA, was included in the stochastic process. The results obtained for the call options price are shown in Table VII:
Table VII Results of the Monte Carlo Simulation Model with LOG RM and EWMA volatility

3.2.5. Jump Diffusion Model
Based on the union of two statistical processes, this model combines characteristics of a Wiener process, which attempts to model the stochastic behavior of the time series, and a Poisson process, which imitates the effect of the jumps that take place in time series. In this case, it represents the jumps presented in the energy futures contracts, as indicated in number 2.5.
We have a daily time series of energy contract prices with N=4,502 data between January, 1997, and October, 2008 (12.33 years). It is necessary to identify the jumps in the original series applied the process indicated in numeral 2.5. We have taken a threshold level of ![]() for the peaks selection. Table VII indicates the initial part of analysis, and shows that 20 filters were carried out in the yields time serie, which produced Np=159 peaks (93 positives and 66 negatives). The probability to be a rising peak is of 63.3%, and a falling peak, of 44.9%. Figure 10 shows the original series and the filtered series.
for the peaks selection. Table VII indicates the initial part of analysis, and shows that 20 filters were carried out in the yields time serie, which produced Np=159 peaks (93 positives and 66 negatives). The probability to be a rising peak is of 63.3%, and a falling peak, of 44.9%. Figure 10 shows the original series and the filtered series.
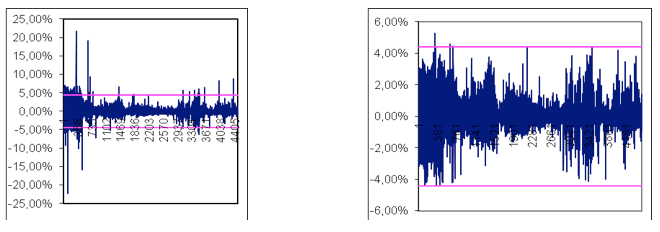
Figure 10. Filtered time Series
----
Table VIII. Peak-Filtering Process of the Contract Price Series ($/kWh)
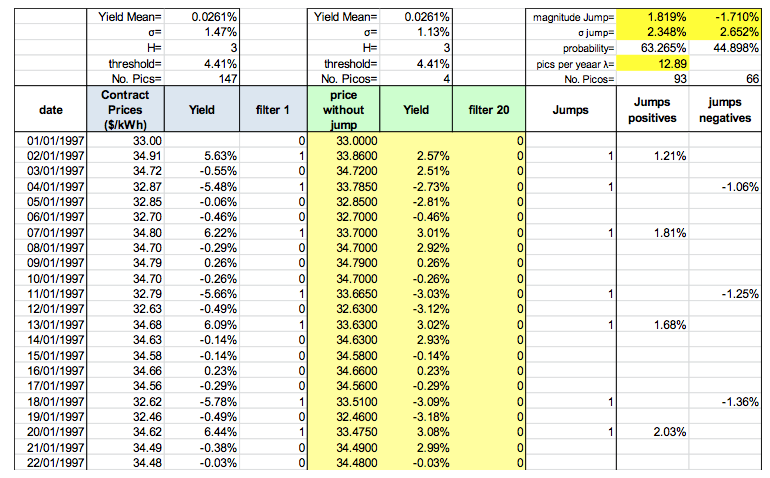
Table IX shows contingency and probability tables. The probability of having a peak is 3.53%. The probability that it to be a peak, since it is a price fall is of 2.76%; while the probability that it to be a peak, since it is a price rise, is of 4.40%. The average magnitude of price rises and falls are 1.82% and -1.71% respectively, with an average volatility of 3.35% and 2.65% respectively. The average number of peaks per year is λ=12.89 (159/12.33 years) or λ=0.035317637 peaks per day (159/4502 years)
Table IX. Contingency and Probability Table

The information related is used in the stochastic process to generate random walks which permit forecasting the price of future contracts at one year ahead via Monte Carlo simulation in order to quantify the price of CALL option. We used the stochastic process lognormal with mean reversion (LOG MR) which include an EWMA model for volatility (identified previously) and a process of jump diffusion d.q(t). Figure 11 shows the histogram of magnitudes for rising or falling of peaks identified (parameter d ) and the frequency q(t) with intensity λ= 0.035317637.
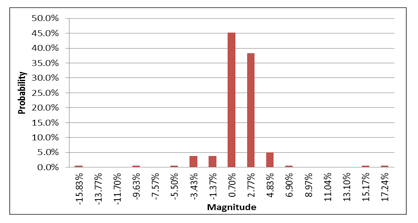
Figure 11. Histogram of magnitudes for rising or falling of peaks
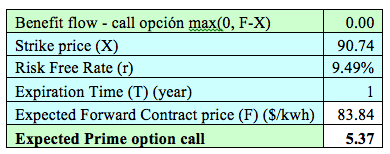
Based on the process indicated in number 2.5, the CALL option price using the Monte Carlo simulation is obtained:
Table X. Results of Jump Diffusion model
4. Conclusions
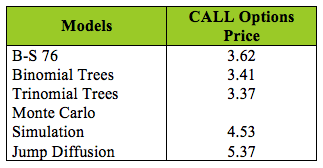
Table XI. Price of the Option on Futures $/kWh
The flexibility of the jump diffusion model, permit include the characteristics inherent in the time series of energy contracts prices. These characteristics are a process of mean reversion, heteroscedasticity and presence of jumps. Incorporating these properties into the model provides more certainty when calculating the options price.
The models BS 76, Binomial and Trinomial trees make assumptions about the normality of the underlying asset and its volatility. Such situation is reflected in the options price, since it is lower than the Montecarlo Simulation and Jump Diffusion models (see Table X). The normality Assuming not consider the rising and falling motions generated by stress situations in the market which produce jump in prices. Likewise, assuming constant volatility means not consider factors that influence prices, such as changes in the supply and demand generated by market situations, operational or weather conditions, and the value of options may be underrated.
For the Jump Diffusion model was compound by a LOG MR stochastic model with heterocedasticity, (the assumption of constant volatility was replaced by an EWMA volatility model), and one homogenous Poisson process in order to capture strong upward or downward trends in a Monte Carlo simulation process for assess the option price. The results indicate that the price of the call option on energy contracts type ToP obtained is (5.37 $/kWh), which is higher than other models used. This may indicate the additional value of the premium as a result of the price jumps and the dynamic volatility process. Such factors are included in the stochastic process used and it is the recommended assess model for these type of contracts in the Colombian market.
Although the negotiation of derivatives contracts type options and futures in a standardized market did not prosper with the resolution CREG 031 of 2005 (SEC) in Colombian market, this paper attempts to show that the options pricing model used, as well as the consideration of the statistic characteristics of underlying asset are essential in order to find the most accurate values of derivatives. As shown, pricing based on Black 76 models underrated the premium price of an option over futures contracts type ToP. Similar studies could be made when the subjacent asset is the spot price in C all or Put options.
In general, the Colombian energy market is evolving towards derivatives markets but this is a slow process that forces market agents to be more specialized and to have pricing and risk-analysis platforms. In this sense, the study recommends using the jump diffusion model for valuate the pricing of derivatives because capture the particular characteristics of Colombian electric market as jumps and changing volatility.
References
Black F, Scholes M. (1973), The Pricing of Options and Corporate Liabilities. The Journal of Political Economy, Vol. 81, No. 3 (May - Jun., 1973), pp. 637-654.
Cartea A, Figueroa MG, (2005), Pricing in Electricity Markets: A Mean Reverting Jump Diffusion Model with Seasonality, Working Paper.
CREG 031 de 2005 (SEC- Sistema Electrónico de Contratación).
CREG 090 de 2011 (MOR – Mercado Organizado para el Mercado Regulado).
Deng SJ, (2000), Stochastic Models of Energy Commodity Prices and Their Applications: Mean-Reversion with Jumps and Spikes, POWER Working Paper, PWP-073 University of California Energy Institute, Berkeley
Deng SJ, Johnson B, Sogomonian l.A. (2001), Exotic Electricity Options and the Valuation of Electricity Generation and Transmission Assets Decision Support Systems, Vol 30, pp. 383–392.
Eydeland A, Geman, H. (1999), Fundamentals of Electricity Derivatives. In: Energy Modelling and the Management of Uncertainty, Risk Books, London.
García JJ, Palacios CM, (2006), La integración energética de los países nórdicos —Nord Pool—lecciones para otros mercados. Lecturas de Economía, 64 (enero-junio), pp. 117-142. © Universidad de Antioquia - Lecturas de Economía,2006.
Geman H, Roncoroni A, (2006), Understanding the Fine Structure of Electricity Prices; Journal of Business, 2006, 79, 3, 1225-1261.
Hull J, (2009), Options, Futures and Other Derivates. Prentice Hall, New York
Johnson B, Barz G, (1999), Selecting Stochastic Processes for Modelling Electricity Prices In: Energy Modelling and the Management of Uncertainty, Risk Books, London.
Kaminski V, (1997), The Challenge of Pricing and Risk Managing Electricity Derivatives. In: The US Power Market. Risk Books, London.
Lucia JJ, Schwartz ES, (2002), Electricity Prices and Power Derivatives: Evidance from the Nordic Power Exchange, Review of Derivatives Research, 5, 5-50.
Merton RC, (1976), Option Pricing when Underlying Stock Returns are Discontinuous, Journal of Financial Economics 3, 125–144.
Pilipović D, (1998), Energy Risk: Valuing and Managing Energy Derivatives: Valuing and Managing Energy Derivatives. McGraw Hill. New York
Salazar MG, Pantoja J, (2011). Los precios forward sobre electricidad ¿Determinados racionalmente por los agentes del mercado colombiano?, Revista Universidad EAFIT. Issue 18, January-June, Medellín.
Seifert J, Uhrig-Homburg M, (2006), Modelling Jumps in Electricity Prices: Theory and Empirical Evidence. Chair of Financial Engineering and Derivatives, Universitat Karlsruhe (TH) Germany, Current version: May 21.
Weron R, (2006), Modeling and Forecasting Electricity Loads and Prices, pp. 136-153.
Weron R, Bierbrauer M, Truck S, (2004), Modeling Electricity Prices: Jump Diffusion and Regime Switching, Physica A 336, 39–48.
Woo CK, Horowitz I, Hoang K. (2001), Cross Hedging and Forward-Contract Pricing of Electricity, Energy Econ; 23:1–15.
1.Received the specialist degree in finances and project valuation from Antioquia University in 1996, D.E.A and Doctor Degree in statistic from Complutense University of Madrid in 2003 and 2007 respectively. He is Associate Professor of National University of Colombia and director of research team (GIFIG) of Minas Faculty, his current research line are the modelling uncertainty and quantification of market, credit and operative risks.
2. Received the degree in management engineer from Nacional University in 1992, D.E.A and Doctor(c) degree in International Business from San Pablo CEU University of Madrid. He is Titular Professor of I.U. Tecnológico de Antioquia and director of research team (RED) his current research line are the modelling uncertainty and quantification of market, credit and operative risk.
3. PhD (c) de la Universidad Paris XII (Francia), D.E.A de la Universidad de Comillas (Madrid), Especialista of Received the D.E.A degree from University of Comillas (Madrid) in Economy and regulation energy sector in 2003. She is currently ending his PhD thesis and is working as R&D engineer in the field of Quatification of Risk in large electrical Power Grid.
4. Received the PhD degree in
Physics in 1987. He worked as R&D Engineer at CGE – Laboratoires de Marcousis, Alcatel Alsthom Recherche, Alstom Technology, Alstom T & D, Areva T&D and as Associate Director of Research CNRS, LSS Supelec. He is currently R&D Project Leader Alstom Grid. His current research interest is risk analysis in large electric Power Grid.
5. In the Money: It produces positive cash flow for the owner if executed immediately. For example, in a CALL option, the spot price > exercise price.
6. Out the Money: It produces negative cash flow for the owner if executed immediately. For example, in a CALL option, the spot price > the exercise price.
7. At the Money: It produces zero cash flow for the owner if executed immediately. For example, in a CALL option, the spot price = the exercise price.